


|
akutek.info |
|
The www center for search, research and free sharing in acoustics |

|
Reverberation |
|
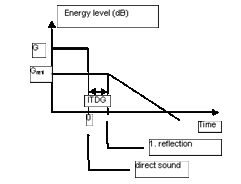
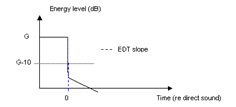
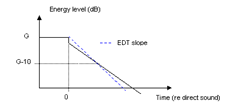
Reverberation For a receiver in a room, reverberation is a decaying tail of reflected sound from a source. Impulse response The impulse response is the sound-pressure vs time data measured after a perfect impulse from a source. In a level vs time diagram, an initial impulse will be followed by peaks and dips corresponding to the time-varying energy density, with an overall decreasing tendency. Such a diagram is often called a reflectogram or an echogram, since it shows the arrival times of reflections and echoes. The diagram describes reverberation the way it can be perceived after e.g. percussive instruments and consonants of speech. Decay Curve The reverberation tail following the end of a sound of sufficient duration (long enough to create a steady state sound field) represented by an energy-time diagram is denoted the decay curve, which is generally frequency specific. The decay curve describes reverberation the way it can be perceived by listeners e.g. after the end of a musical phrase and in particular after the final note of a musical work. This is the aftersound. Technically, the decay curve can be obtained by backward (Schroeder) integration from an impulse response measurement, and is then referred to as the Schroeder Curve. In principle, the decay curve develops from t=0 (direct sound arrival) as follows (Figure 1): · At t=0, the level is equal to G, the total received (direct and reverberant) energy level · At t=0+, the level is equal to the total reflected energy level Grefl ; The more dominating the direct sound is, the larger is the step down from t=0 to t=0+, and vice versa; Less distance to the source and/or more sound absorption causes larger step down, and vice versa) · Between t=0+ and t=ITDG (initial time delay gap), the decay curve is flat, since the interval contains no sound energy · At t>ITDG, a decay curve will deviate more or less from a falling slope, the deviations being caused by uneven temporal distribution (strong reflections, echoes, time-gaps) and/or room modes, esp. at frequencies lower than the Schroeder Frequency ~2000·(T/V)0.5 In its simplest form, the slope is a single straight line falling with a tendency close to 60dB / RT, typical for reverberant sound fields with even spatial distribution The double slope decay typically occurs if the sound absorption is unevenly distributed, e.g. excess absorption in the floor-ceiling axis, leaving a reverberant sound field remaining between a pair or a quadruple of hard walls; Another common example is the remaining energy slope from an undamped, coupled room. Reverberation Time A simple decay slope can be represented by a single number with unit dB/s. Although the impulse response has an overall decaying tendency, its level-time curve deviates significantly from a simple slope, making it difficult to determine a single number representing the reverberation properly. In contrast, such simple slopes are much more prominent in the down-step response, i.e. the decay curves of the aftersound (here: the reverberation after a sound source stops, not to be confused with the aftersound in our hearing). Therefore, it is to be expected that a single number representation like the Reverberation Time (RT) correlates better with the perception of the aftersound, than with the perception of an impulse response. This difference can be heard e.g. if comparing the aftersound following the final chord from a choir with the aftersound following the impulse from a percussive instrument in the same room. The latter may leave a complex auditive impression (including echoes), despite the simple character of the first. The ideal decay curve, occurring in a perfect diffuse sound field, is a sloping straight line. The time it takes for this slope to decay by 60dB is defined as the reverberation time RT60. More often, RT is calculated from the time interval from -5dB to -35dB on the decay curve, and denoted RT30 or T30. Early Decay Time (EDT) could be defined as 6 times the time interval from 0dB to -10dB on the decay curve, Figure 2. However, in measurement standards and prediction tools EDT is often defined by the straight line that best fits the data set in the range of 0 to –10dB. The EDT measure was first suggested by V.L.Jordan in 1968. From being the one and only room acousical parameter, to being just one among many suggested parameters, RT could seem to have lost its importance. However, it can be shown that RT governs 4 out of 5 listener aspects in ISO 3382: Reverberation Time—the mother of all room acoustical parameters (paper); (Presentation).
|
|
Reverberation, decay curves, reverberation time RT, EDT, Reverberance |
|
Figure 1. Decay curve |
|
Figure 2 |
|
Figure 3. Decay curve and EDT typical for audience |
|
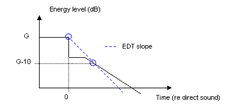
Figure 4. Decay curve and EDT typical for performers |
|
Reverberance It is established that EDT correlates with Reverberance, i.e. perceived reverberation during music play or speech, at least as perceived by the audience, Figure 3. One should note that EDT is very sensitive to influence from the direct sound component, so one can not expect EDT to describe reverberance well for listeners very close to the source. When Grefl is less than G-10dB, which is typical with source-receiver distances shorter than a couple of meters, the relationship between Reverberance is difficult: Depending on which definition is chosen, the EDT is either equal to zero, Figure 4, or the EDT obtained by linear regression correlates poorly with the data set. There are some alternative ways to deal with this difficulty: 1. The impression of Reverberance is not perceived when G- Grefl >10dB 2. Reverberation perceived by performers (short source-receiver distance) is an impression not similar to the Reverberance perceived by the audience. Reverberation perceived by performers can not be described by EDT. This calls for a new descriptor for Performers Reverberance. 3. The impression of Reverberance is perceived even when G- Grefl >10dB (EDT ->0), but EDT does not describe Reverberance in such cases. This calls for a parameter of more general validity than EDT. Since also performers seem to perceive reverberance, 1 is eliminated. An example of alternative 2 is ISO 3382 annex C, which suggests the STlate as a measure for reverberance perceived by performers on orchestra platforms. However this leaves us with a transition zone between performer and listener where Reverberance is not defined. Alternative 3 suggests that listeners and performers just perceives different degree of Reverberance. In the future, a unifying measure, valid continuously throughout the performance space, may substitute the pair EDT and STlate. Running Reverberation Assuming that the impulse response describes the reverberation after a single impulse like a hit on a woodblock, and that the decay curve and RT describes the reverberation following the final of a musical phrase: Music is far, far more than single impulses and phrase-ends. What about the reverberance from all the music in between? Can reverberation in different environment be perceived as equivalent during a passage of music, even if decay rates and levels are different? For instance - can the short and strong reverberation of a rehearsal room and the weaker and longer reverberation of a concert hall stage sound similar to the performer? You may judge for yourself in the reverberance sound demo. Running reverberation RR has been suggested as a measure of the reverberance perceived during while music is being played. How loud is my Reverberation?, D Griesinger asks in an akuTEK publication. Listening tests with solo instrument played with reverb of varying level and reverb time were performed, testing for match of perceived reverberation levels. “The observation that curves (level-time curves, editorial note) made with a 160ms integration time tend to cross at about 160ms if two spaces have similar musician self support leads to proposal that musician self support can be measured with RR160”. RR160 = E(0-160)/E(160-320) Here E(0-160) and E(160-320) denotes the energy of the impulse response in the two intervals 0-160ms and 160-320ms respectively. RR160 is thus the energy ratio of the 160ms intervals before and after the time 160ms of the impulse response. During solo play, perceived reverberation level tended to be equal whenever RR160 values were equal. Level matching of perceived reverberation during quartet play and orchestral music led to different results than the level matching during solo play, simply because circumstances are different. Running Reverberation, or reverberance, i.e. perceived reverberation during play or speech, is not a property of the room alone, but a property of the interplay between source and the room. Griesinger suggested a measure for the Running Reverberation during orchestral music based on the Schroeder curve, similar to the original EDT measure, evaluating the slope of a straight line from the top point to the 350ms point of the Schroeder curve. Denoting the top point level S0 and the 350ms point level S350, the running reverberation in orchestral music is RR(Orchestral) = 0.35s∙60/(S0-S350) During orchestra play, perceived reverberation level tended to be equal whenever RR(Orchestral) values were equal. According to Griesinger, It is possible to come up with similar measures of RR for speech with very little scatter in the data.
Interrelated akuTEK research topics Current view in akuTEK Research is that the following topics are strongly related: stage acoustics, rehearsal rooms, performer’s perception, perceived reverberation. Stage acoustics and rehearsal room acoustics are important in order to develop musicians, orchestras and provide for good playng conditions—to the benefit of the listeners—and must be supported by knowledge of performer’s perception in general, and perceived reverberance in particular Traditionally, rehearsal room acoustics is described by reverberation time (RT). Read more about room acoustic parameters on the AKUTEK page And in the AKUTEK article Listening aspects related to room acoustical effects on music Read about simplified room acoustic measurements. Tonal response in rooms (Microstructure of room acoustic FR), Table: Concert hall data External resources Can reverberation be visualized with the use of an Audio Camera? Visualizing Concert Hall Reverberation Reverberation in a Small Room (with demo) H Arau-Puchades: An Improved Reverberation Formula H Arau: The Refurbishment of the Orchestra Rehearsal Room of the Great Theater of Liceu Neubauer and Kostek: Prediction of the Reverberation Time in Rectangular Rooms with Non-Uniformly Distributed Sound Absorption |
|
on site |